Robey Analytics LLC
  • Contact
  • Portfolio
    • Economic Impact Studies
    • Community Analysis
    • Regional & State Strategies
    • Other Presentations
    • Evaluations & Workforce Projects
    • Academic Works
  • Robey Report
  • Contact
  • Portfolio
    • Economic Impact Studies
    • Community Analysis
    • Regional & State Strategies
    • Other Presentations
    • Evaluations & Workforce Projects
    • Academic Works
  • Robey Report
  •  

Robey Report

2023 12 09 Economists like to work on the margins and the marginal change.

Economists like to work on the margins and the marginal change. Due to this, it may be argued that economics is a relative sport. In listening to the pundits on Fox Business and comments in the Wall Street Journal recently, there has been a shift from a “soft” landing to the likelihood of a recession. Part of that discussion is driven by changes in several measures – most notably changes in labor market conditions. But it matters greatly what is used as a baseline for estimating that change.  

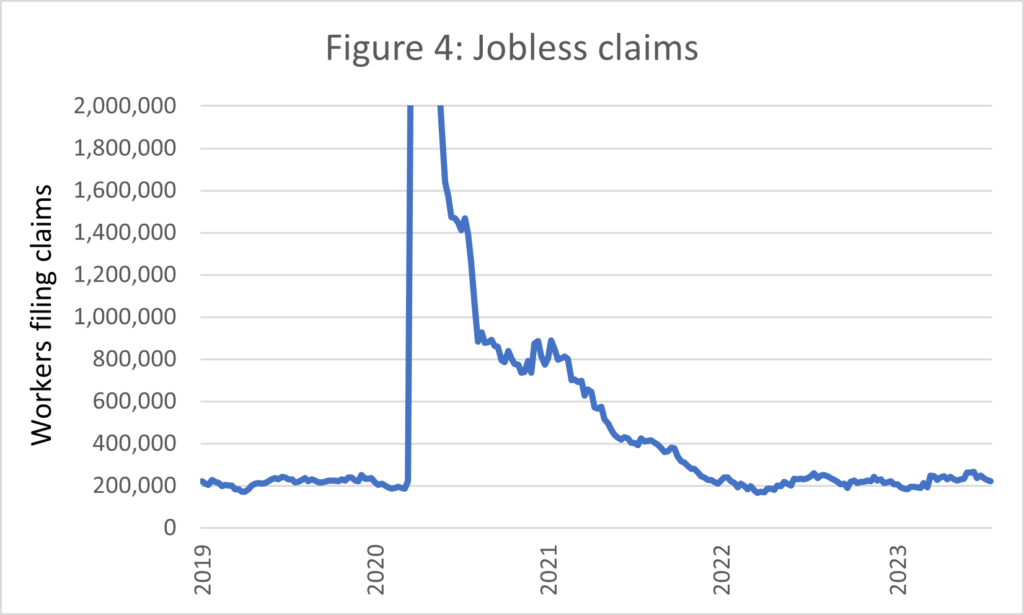
In looking at Initial Claims and Continued Claims unemployment data from the U.S. Bureau of Labor Statistics and retrieved from FRED (fred.stlouisfed.org), the timing of change matters. For Initial Claims, the month-over-month (M/M) change is less than -1%, while the 4-week moving average is about 4.4%. So depending on the measure, the claims filed are about the same, or somewhat higher than a month ago. If the year-over-year (Y/Y) period is considered, Initial Claims filings are up about 5,000 or 2.4%, with the 4-week moving average up 7,500 or 3.5%. The Y/Y is probably setting off alarm bells that the economic sky is falling. But wait! When current data are compared to pre-COVID initial filings from the first week of 2020, claims are down just under 2% and the 4-week moving average is down almost 4%. So, is the sky falling back to trend? Possibly. Take a look at Figure 1. 

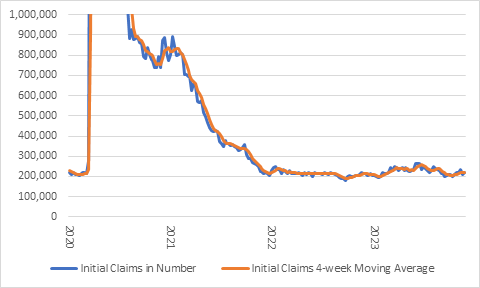
 Figure 1: Initial Claims 

Source: U.S. Bureau of Labor Statistics and the Federal Reserve Bank of St. Louis 

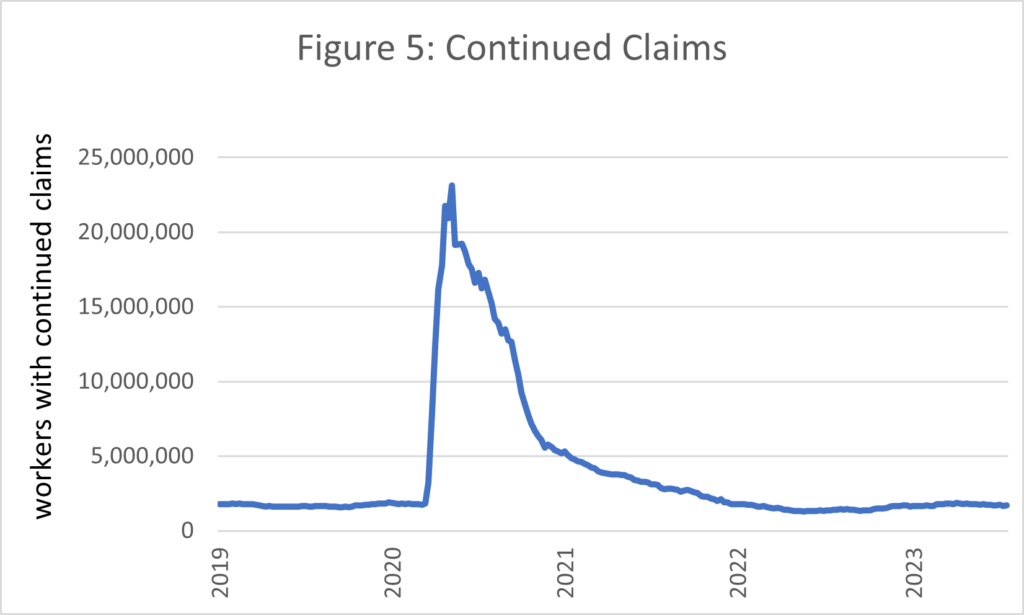
Continuing claims, or those workers who filed an initial claim and then experienced at least a week of unemployment, may tell a slightly different and more troubling story. The M/M trend for initial filings is up 6.3% and up 24% for Y/Y claims. Similarly the continued 4-week moving average for M/M  is up about 6.1% and the Y/Y at 28.3%. This is troubling, at least in the short run. But when compared to the data from January of 2020, the Continued Claims are up 2.5% and the 4-week moving average is up 1.3%. Relatively speaking, Continued Claims, and as shown in Figure 2, are at about the same level now that they were in early 2020.  

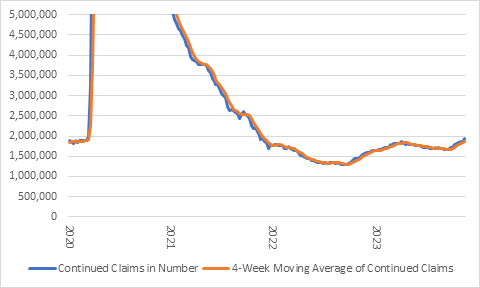
Figure 2: Continued Claims 

Source: U.S. Bureau of Labor Statistics and the Federal Reserve Bank of St. Louis 

It may be argued that the figures above don’t show enough history, and that using January of 2020 is biased. However, it is also arguable that choosing any data points for analysis and comparisons is biased. But in looking forward into 2020 early in that year, and for much of the first quarter, most economists predicted a robust economy with no recession in sight. While many saw COVID-19 affecting supply chains in the Pacific Rim, few saw the broader impacts that would send the global economy into a relatively short recession. Thus, it is arguable that it is a pretty good place to start. 

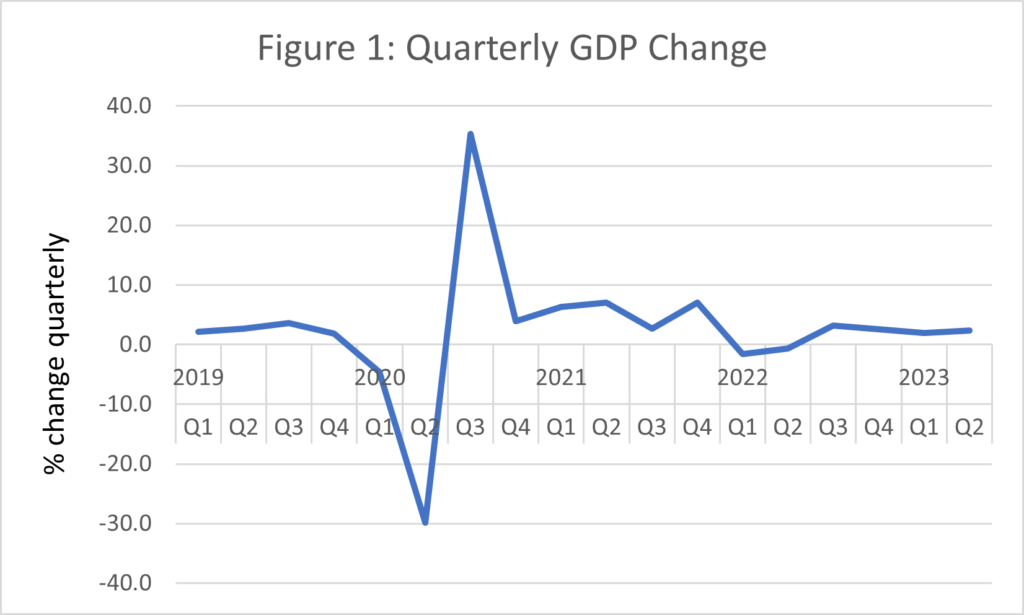
There are, however, some signs that the economy is likely to slow. Current forecasts from the University of Michigan sees real GDP growth at 1.7%i. Similarly, the Survey of Professional Forecasters at the Federal Reserve Bank of Philadelphiaii also expect 1.7% growth in real GDP for 2024. The forecast for future real GDP growth is well below the Q3 estimate from the Bureau of Economic Analysisiii (BEA) of 5.2% growth in Q3, which was revised upward in this second estimate. But as reported on December 6th, the Federal Reserve Bank of Atlanta’s GDPNowiv estimate of Q4 GDP growth is 1.3%.  

What are some factors that may support the slowing in the economy that aren’t necessarily indicated in the labor market data? Some could include: 

  • The ISM Nonmanufacturing Index for November is still in expansion at 52.7—if the Index slips below 50 it is in contraction. 
  • The number of job openings reported in the JOLTS report for October is down M/M 820,000 to 8.7 million.  
  • Vehicle sales are well below trend of 16.7 million units to the BEA’s reporting 15.3 million units in November. 
  • The ISM Manufacturing Index remains in contraction below 50 at 46.7 for November. This was the same level as October. 
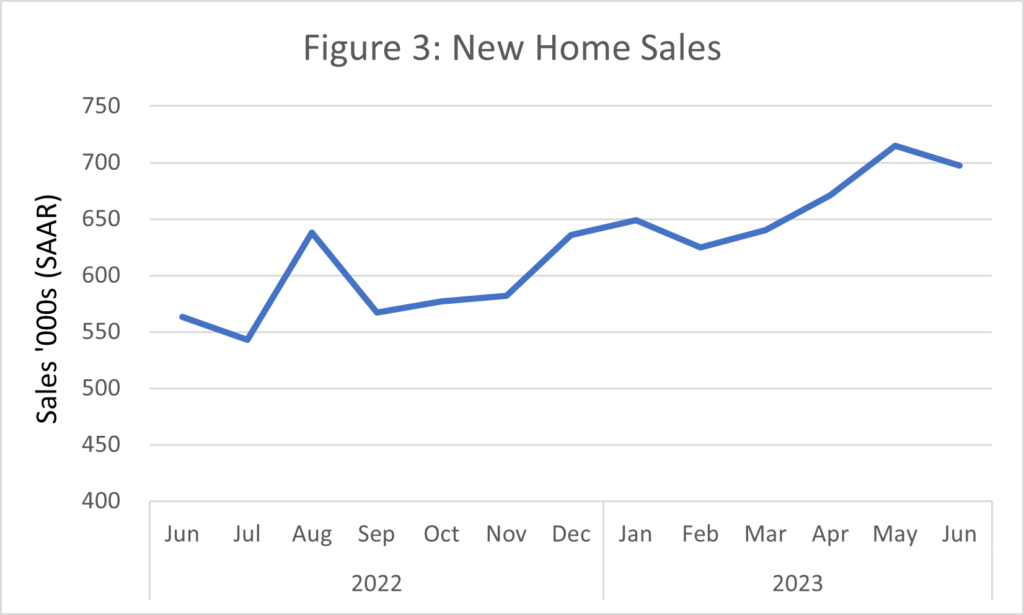
  • Pending home sales are down 1.5% for October. 

While the economy appears to be strong, at least from a labor market perspective, there are signs of weakness in other economic measures that support the outlook from many the forecasters that the U.S. economy will grow at lower rates than in 2023.  

  • 15 December, 2023
  • Uncategorized
  • More

Robey Report: Data Release for the End of July

This blog features a synthesis of economic data recently reported through various media for a specific reference period.  For the purposes of this blog and based on when it is posted to the website, “recently” will mean a reference period that is either the first or the second half of the month in which the blog is posted. This blog focuses on data released between the 15th and the 31st of July.

Note that data flows and releases are relatively constant and so any time a “stake is in the ground” around data, the analysis will already be out of date. While the blog will usually focus on a significant piece of data released, I’ll also try to include some headwinds and tailwinds affecting the economy or indicating the trends and health of the economy.

In the second half of July, the Federal Open Market Committee (FOMC) increased the Fed Funds rate by 250 basis points or .25%. Inflation has been trending downward toward the Fed’s target rate of 2%. But the Fed continues to say it is data dependent, so as new data become available on inflation, jobs, and sales, the trends in the data will drive the direction of the Fed’s decisions.

The trend in increasing interest rates (see Figure 1) affects the ability of both consumers and businesses to purchase and invest by pushing up borrowing costs. In the period prior to the COVID-19 pandemic, many academic colleagues argued that it was okay for the Federal government to borrow because the cost of money was near zero. This may be true until it isn’t. With a debt of $32 trillion, the move from near-zero costs of money to borrowing based on rates between 5.25% and 5.5% will influence the economy.

Source: Federal Reserve Bank of St. Louis; https://fred.stlouisfed.org/series/DFF

The headwind could be the reduced volume of business due to higher costs. But in many ways, the cost of borrowing is returning prior rates that may be consistent with the longer-run rate trend rather than the lower rates people have come to expect in recent times. People and businesses continue to be part of and engage in the economy

The first tailwind, even with the increase in the rates over the last year, is that the economy grew at 2.4% in Q2. (Note that this is the first estimate and there will be revisions based on additional data.) If this growth rate holds, it will be something of a return to the growth rates in the pre-COVID period. The rate from Q1:2010 through Q4:2019 averaged 2.3%/ Figure 2 shows the trends since 2019.

Existing home sales slowed slightly during the reference period. That may be due more to supply than demand—you can’t sell and deliver homes when they aren’t available. There is some discussion in the Wall Street Journal and other media outlets that part of the lack of supply is that existing homeowners have mortgages with low-interest rates and new purchases would require mortgages with higher rates.

The new home sales data show a different perspective. The year-over-year (Y/Y) change for new home sales in June 2023 was 23.8 % higher than for June 2022 (annualized at 687,000 new home sales versus 563,000, respectively). The median sales price across the country was $415,000 and the average was $494,700. As shown in Figure 3, sales of new homes have been trending upward over the last year.

Source: https://www.census.gov/construction/nrs/current/index.html

It was expected that increasing interest rates would help to cool inflation and lead to job cuts and layoffs. But the data for the reference period have not shown that—another tailwind. As shown in Figure 4, jobless claims are trending down rather than up and are running near a pre-COVID trend. The unemployment rate for June (the most recent U-3 rate) was 3.6%, arguably with all the rate increases, the U.S. economy is at full employment.

Source: Federal Reserve Bank of St. Louis; https://fred.stlouisfed.org/series/ICSA

Similarly, continued claims (people who filed in the current week as well as the prior week) have returned to a trend (see Figure 5). This was something closely watched during the pandemic. The number of initial claims during COVID started to trail off, but continued claims were more persistent and a better indicator of people returning to work.

Source: Federal Reserve Bank of St. Louis; https://fred.stlouisfed.org/series/CCSA

Finally, other indicators are trending as tailwinds. First, consumers seem to be more positive.  In a recent press release[i] the Conference Board reported that its consumer confidence index rose to 117 in July, up from 110 in June. The Wall Street Journal reported that nearly 85% of prime-aged workers (aged 25 to 54) were either working or looking for work.[ii] This was true for prime-aged men and women. And last, but not least, the labor force participation rate (those 16+ who are working or looking for work) has returned (generally) to trend at 62.6%.

So far it would seem that the efforts by the Fed are having some effect, with inflation slowing but still above the target of 2%. However, consumers seem to be positive and active in markets including housing and autos. In many cases, it seems to be supply that is driving the numbers rather than demand. People seem to be either working or looking for work and employers continue to be hiring.


[i] https://www.conference-board.org/topics/consumer-confidence

[ii] https://www.wsj.com/articles/americans-working-job-market-prime-age-9fdc339b?st=oulrd4d76kig7er&reflink=desktopwebshare_permalink

  • 7 August, 2023
  • Uncategorized
  • More

Recent Posts

  • 2023 12 09 Economists like to work on the margins and the marginal change.
  • Robey Report: Data Release for the End of July

Recent Comments

No comments to show.

Archives

  • December 2023
  • August 2023

Categories

  • Uncategorized
Copyright © 2023 Robey Analytics LLC. Design by Sheri Robey Lapan